Airbnb 데이터를 활용한 데이터 분석
[ Project ] Airbnb 데이터를 활용한 데이터 분석
본 프로젝트는 1) 데이터 읽기 2) 데이터 전처리 3) 데이터 시각화 4) 데이터 추가 전처리 + 분석으로 총 4단계로 이루어져 있습니다.
※ 분석의 목적은 다음과 같습니다.
1) 뉴욕시 지도위의 Airbnb를 전사해 보는 것으로 지역별 가격을 비교해봅니다.
2) 방의 타입별로 가격에 차이가 있는지 분석해봅니다.
1. 데이터 살펴보기
① 데이터
- 이 프로젝트에서 사용하는 데이터는 Airbnb 데이터입니다.
- https://www.kaggle.com/dgomonov/new-york-city-airbnb-open-data 에서 공개된 데이터를 사용합니다.
② 환경셋팅
- 이 프로젝트를 진행하기 위해서는 아래의 라이브러리가 설치되어 있어야합니다. Pandas, matplotlib, re
- 개인의 컴퓨터에서 Jupyter Notebook 을 설치하기 힘든 상황이라면, Azure Notebook(https://notebooks.azure.com/) 을 사용하셔도 됩니다.
③ 필드
- id, name, host_id, host_name
- neighbourhood_group, neighbourhood, latitude, longitude
- room_type, price, minimum_nights
- number_of_reviews, last_review, reviews_per_month
- calculated_host_listings_count, availability_365
2. 데이터 읽기
해당 챕터의 목표
- csv로 저장되어 있는 데이터를 불러 올 수 있습니다.
- 불러온 데이터의 필드와 데이터수를 확인하는 것으로 추후 분석의 기초를 마련합니다.
- Null 데이터의 개수를 확인하는 것으로 전처리를 하기 위한 배경 지식을 얻습니다.
제공되는 코드
import pandas as pd
데이터 읽기 문제
문제에서 사용할 함수(다른 함수를 사용하는것으로 같은 결과를 출력할 수 있지만 가능한 아래의 함수를 사용해주세요)
- read_csv, columns, shape, isnull, sum
[Quiz 1] pandas의 함수를 사용하여 AB_NYC_2019.csv을 읽어와 data라는 이름의 변수로 저장합니다.
data = pd.read_csv('./AB_NYC_2019.csv')
[Quiz 2] data 의 필드명, 필드개수, 데이터 수를 출력합니다. print 함수로 화면에 명시적으로 출력합니다.
print(data.columns)
print(data.shape)
print(data.count())
print(data.info())
Index(['id', 'name', 'host_id', 'host_name', 'neighbourhood_group',
       'neighbourhood', 'latitude', 'longitude', 'room_type', 'price',
       'minimum_nights', 'number_of_reviews', 'last_review',
       'reviews_per_month', 'calculated_host_listings_count',
       'availability_365'],
      dtype='object')
(48895, 16)
id                                48895
name                              48879
host_id                           48895
host_name                         48874
neighbourhood_group               48895
neighbourhood                     48895
latitude                          48895
longitude                         48895
room_type                         48895
price                             48895
minimum_nights                    48895
number_of_reviews                 48895
last_review                       38843
reviews_per_month                 38843
calculated_host_listings_count    48895
availability_365                  48895
dtype: int64
<class 'pandas.core.frame.DataFrame'>
RangeIndex: 48895 entries, 0 to 48894
Data columns (total 16 columns):
id                                48895 non-null int64
name                              48879 non-null object
host_id                           48895 non-null int64
host_name                         48874 non-null object
neighbourhood_group               48895 non-null object
neighbourhood                     48895 non-null object
latitude                          48895 non-null float64
longitude                         48895 non-null float64
room_type                         48895 non-null object
price                             48895 non-null int64
minimum_nights                    48895 non-null int64
number_of_reviews                 48895 non-null int64
last_review                       38843 non-null object
reviews_per_month                 38843 non-null float64
calculated_host_listings_count    48895 non-null int64
availability_365                  48895 non-null int64
dtypes: float64(3), int64(7), object(6)
memory usage: 6.0+ MB
None
[Quiz 3] data 의 필드명 null 데이터의 숫자를 출력합니다.
data.isnull().sum()
id                                    0
name                                 16
host_id                               0
host_name                            21
neighbourhood_group                   0
neighbourhood                         0
latitude                              0
longitude                             0
room_type                             0
price                                 0
minimum_nights                        0
number_of_reviews                     0
last_review                       10052
reviews_per_month                 10052
calculated_host_listings_count        0
availability_365                      0
dtype: int64
3. 데이터 전처리
해당 챕터의 목표
- 가지고 온 데이터의 일부 값이 완전하지 않은 경우가 있습니다.
완전하지 않은 데이터를 사용하면 분석 결과에 오차가 생기거나 분석을 하지 못하는 경우가 발생합니다.
완전하지 않은 값을 수정하거나 해당 데이터를 삭제하는 것으로 추후 분석이 가능한 데이터를 구축합니다.
데이터전처리 문제
문제에서 사용할 함수 (다른 함수를 사용하는것으로 같은 결과를 출력할 수 있지만 가능한 아래의 함수를 사용해주세요)
- notnull
[Quiz 4] name과 host_name에서 null인 데이터를 제거합니다.
data = data[pd.notnull(data.name) & pd.notnull(data.host_name)]
data.isnull().sum()
id                                    0
name                                  0
host_id                               0
host_name                             0
neighbourhood_group                   0
neighbourhood                         0
latitude                              0
longitude                             0
room_type                             0
price                                 0
minimum_nights                        0
number_of_reviews                     0
last_review                       10037
reviews_per_month                 10037
calculated_host_listings_count        0
availability_365                      0
dtype: int64
data.shape
(48858, 16)
4. 데이터 시각화
해당 챕터의 목표
- 전처리가 완료된 데이터를 사용하여 데이터를 시각화합니다.
- Price의 백분위를 구해 이상치를 제거합니다.
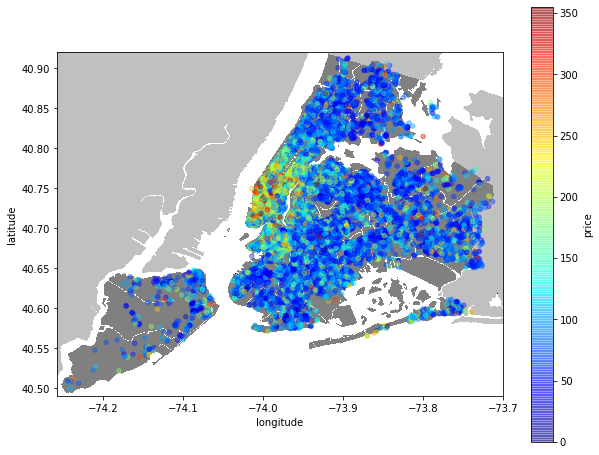
- 제공 된 지도 위에 데이터를 매핑하는 것으로 뉴욕시의 지역별 Airbnb 가격 분포를 확인해봅니다.
제공되는 코드
# data의 경우 데이터 전처리가 완료된 값을 사용해주세요.
import matplotlib.pyplot as plt
import numpy as np
visual_data = data

# 3번 문제
# newyorkcity = plt.imread('newyorkcity.png')
# plt.figure(figsize=(10,8))
# plt.imshow(newyorkcity, zorder=0, extent=[-74.258, -73.7, 40.49,40.92])
# ax = plt.gca()
데이터 시각화 문제
- 전처리가 완료된 데이터를 사용해주세요.
- Quiz6과 Quiz7에서는 아래의 파라미터를 사용해주세요.
- cmap=plt.get_cmap(‘jet’), colorbar=True, alpha=0.4, figsize=(10,8)
문제에서 사용할 함수(다른 함수를 사용하는것으로 같은 결과를 출력할 수 있지만 가능한 아래의 함수를 사용해주세요)
- describe, plot, show
[Quiz 5] price의 백분위 5%, 25%, 50%, 75%, 95% 를 구합니다.
visual_data.describe()
| id | host_id | latitude | longitude | price | minimum_nights | number_of_reviews | reviews_per_month | calculated_host_listings_count | availability_365 | |
|---|---|---|---|---|---|---|---|---|---|---|
| count | 4.885800e+04 | 4.885800e+04 | 48858.000000 | 48858.000000 | 48858.000000 | 48858.000000 | 48858.000000 | 38821.000000 | 48858.000000 | 48858.000000 |
| mean | 1.902335e+07 | 6.763169e+07 | 40.728941 | -73.952170 | 152.740309 | 7.012444 | 23.273098 | 1.373229 | 7.148369 | 112.801425 |
| std | 1.098289e+07 | 7.862389e+07 | 0.054528 | 0.046159 | 240.232386 | 20.019757 | 44.549898 | 1.680328 | 32.964600 | 131.610962 |
| min | 2.539000e+03 | 2.438000e+03 | 40.499790 | -74.244420 | 0.000000 | 1.000000 | 0.000000 | 0.010000 | 1.000000 | 0.000000 |
| 25% | 9.475980e+06 | 7.818669e+06 | 40.690090 | -73.983070 | 69.000000 | 1.000000 | 1.000000 | 0.190000 | 1.000000 | 0.000000 |
| 50% | 1.969114e+07 | 3.079133e+07 | 40.723070 | -73.955680 | 106.000000 | 3.000000 | 5.000000 | 0.720000 | 1.000000 | 45.000000 |
| 75% | 2.915765e+07 | 1.074344e+08 | 40.763107 | -73.936280 | 175.000000 | 5.000000 | 24.000000 | 2.020000 | 2.000000 | 227.000000 |
| max | 3.648724e+07 | 2.743213e+08 | 40.913060 | -73.712990 | 10000.000000 | 1250.000000 | 629.000000 | 58.500000 | 327.000000 | 365.000000 |
visual_data['price'].quantile(0.05)
40.0
visual_data['price'].describe()['25%']
69.0
visual_data['price'].describe()['50%']
106.0
visual_data['price'].describe()['75%']
175.0
visual_data['price'].quantile(0.95)
355.0
- 리뷰
- 잘해주셨습니다.
- describe와 quantile 모두를 사용해 잘 풀어주셨네요!
- describe의 경우 quantile에 대한 parameter 값을 주시면
- 위의 백분위수를 모두 표현할 수 있습니다
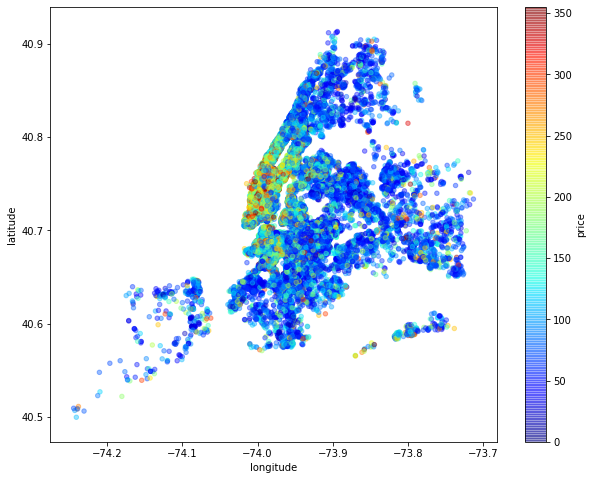
[Quiz 6] price의 백분위 95% 값보다 큰 데이터를 필터링(->제거한) 후, x축을 longitude y축을 latitude, c값(그래프에서의 색상)을 price로 하는 scatter 그래프를 그립니다.
# 수정 : 백분위 95% 초과 값 제거
# visual_data = visual_data[visual_data['price'] >= visual_data['price'].quantile(0.95)]
visual_data = visual_data[visual_data['price'] <= visual_data['price'].quantile(0.95)]
visual_data
| id | name | host_id | host_name | neighbourhood_group | neighbourhood | latitude | longitude | room_type | price | minimum_nights | number_of_reviews | last_review | reviews_per_month | calculated_host_listings_count | availability_365 | |
|---|---|---|---|---|---|---|---|---|---|---|---|---|---|---|---|---|
| 0 | 2539 | Clean & quiet apt home by the park | 2787 | John | Brooklyn | Kensington | 40.64749 | -73.97237 | Private room | 149 | 1 | 9 | 2018-10-19 | 0.21 | 6 | 365 |
| 1 | 2595 | Skylit Midtown Castle | 2845 | Jennifer | Manhattan | Midtown | 40.75362 | -73.98377 | Entire home/apt | 225 | 1 | 45 | 2019-05-21 | 0.38 | 2 | 355 |
| 2 | 3647 | THE VILLAGE OF HARLEM....NEW YORK ! | 4632 | Elisabeth | Manhattan | Harlem | 40.80902 | -73.94190 | Private room | 150 | 3 | 0 | NaN | NaN | 1 | 365 |
| 3 | 3831 | Cozy Entire Floor of Brownstone | 4869 | LisaRoxanne | Brooklyn | Clinton Hill | 40.68514 | -73.95976 | Entire home/apt | 89 | 1 | 270 | 2019-07-05 | 4.64 | 1 | 194 |
| 4 | 5022 | Entire Apt: Spacious Studio/Loft by central park | 7192 | Laura | Manhattan | East Harlem | 40.79851 | -73.94399 | Entire home/apt | 80 | 10 | 9 | 2018-11-19 | 0.10 | 1 | 0 |
| ... | ... | ... | ... | ... | ... | ... | ... | ... | ... | ... | ... | ... | ... | ... | ... | ... |
| 48890 | 36484665 | Charming one bedroom - newly renovated rowhouse | 8232441 | Sabrina | Brooklyn | Bedford-Stuyvesant | 40.67853 | -73.94995 | Private room | 70 | 2 | 0 | NaN | NaN | 2 | 9 |
| 48891 | 36485057 | Affordable room in Bushwick/East Williamsburg | 6570630 | Marisol | Brooklyn | Bushwick | 40.70184 | -73.93317 | Private room | 40 | 4 | 0 | NaN | NaN | 2 | 36 |
| 48892 | 36485431 | Sunny Studio at Historical Neighborhood | 23492952 | Ilgar & Aysel | Manhattan | Harlem | 40.81475 | -73.94867 | Entire home/apt | 115 | 10 | 0 | NaN | NaN | 1 | 27 |
| 48893 | 36485609 | 43rd St. Time Square-cozy single bed | 30985759 | Taz | Manhattan | Hell's Kitchen | 40.75751 | -73.99112 | Shared room | 55 | 1 | 0 | NaN | NaN | 6 | 2 |
| 48894 | 36487245 | Trendy duplex in the very heart of Hell's Kitchen | 68119814 | Christophe | Manhattan | Hell's Kitchen | 40.76404 | -73.98933 | Private room | 90 | 7 | 0 | NaN | NaN | 1 | 23 |
46418 rows × 16 columns
# scatter 그래프 Quiz6, 7 재사용 위해 함수로 작성
def show_price_scatter(ax):
    visual_data.plot.scatter(x='longitude', y='latitude', c='price' , cmap=plt.get_cmap('jet'), colorbar=True, alpha=0.4, figsize=(10,8), ax=ax)
    plt.show()
fig, ax = plt.subplots()
show_price_scatter(ax)
- 리뷰
- 이 부분은 문제를 잘못 이해하신 것 같습니다.
- 백분위 95%보다 큰 값을 필터링 하라는 것이 그 값을 사용하라는 것은 아닙니다.
- 95%이하인 값을 이용하라는 것입니다.
- 2차 리뷰
- 잘 해주셨습니다!
- 조금 더 정확하게 한다면
- 초과인 데이터를 필터링이므로 부호가 <이 아닌 <=이 되는 것이 조금 더 정확하겠네요 :)
- 하지만 잘해주셨습니다!
[Quiz 7] 첨부된 New_York_City_.png 위에다가 퀴즈 6의 Scatter 그래프를 그립니다.
newyorkcity = plt.imread('./newyorkcity.png')
plt.figure(figsize=(10,8))
plt.imshow(newyorkcity, zorder=0, extent=[-74.258, -73.7, 40.49,40.92])
ax = plt.gca()
show_price_scatter(ax)
5. 데이터 추가 전처리 + 분석
해당 챕터의 목표
- 분석 목표에 따라 추가 전처리가 필요한 경우가 있습니다. 이번 프로젝트에서는 분석 전 추가 전처리를 진행합니다.
- 이상한 문자열이 들어간 데이터를 제거하는 것으로 조금 더 formal한 데이터만을 타게팅합니다.
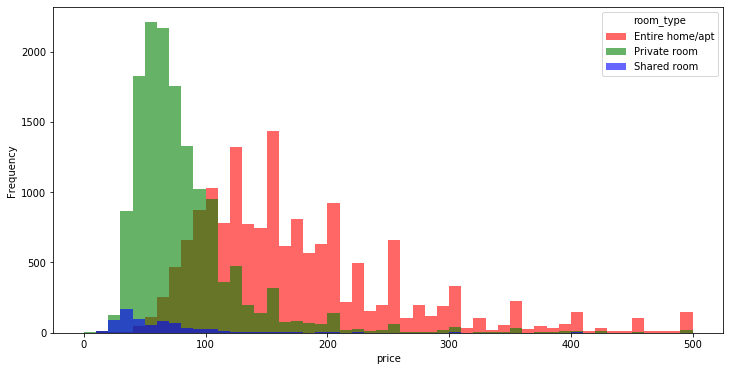
- room_type 이 가격에 영향을 끼치는지를 히스토그램으로 분석해봅니다.
- sql 문을 사용하여 원하는 데이터를 추출해봅니다.
제공되는 코드
# data의 경우 데이터 전처리가 완료된 값을 사용해주세요.
import re
analysis_data = data
# # 4번 문제
import sqlite3
conn = sqlite3.connect(':memory:')
conn.text_factory = str
analysis_data.to_sql(name='data', con=conn)
데이터 추가 전처리 + 분석 문제
문제에서 사용할 함수(다른 함수를 사용하는것으로 같은 결과를 출력할 수 있지만 가능한 아래의 함수를 사용해주세요)
- compile, unique, groupby, get_group, reset_index, head, hist, read_sql
[Quiz 8] re 함수 사용 : name 필드에 영문, 숫자, ‘.’, ‘,’, ‘-‘, ‘#’, 공백 외의 문자가 들어가 있는 데이터를 필터(->제거)합니다.
analysis_data.info()
<class 'pandas.core.frame.DataFrame'>
Int64Index: 48858 entries, 0 to 48894
Data columns (total 16 columns):
id                                48858 non-null int64
name                              48858 non-null object
host_id                           48858 non-null int64
host_name                         48858 non-null object
neighbourhood_group               48858 non-null object
neighbourhood                     48858 non-null object
latitude                          48858 non-null float64
longitude                         48858 non-null float64
room_type                         48858 non-null object
price                             48858 non-null int64
minimum_nights                    48858 non-null int64
number_of_reviews                 48858 non-null int64
last_review                       38821 non-null object
reviews_per_month                 38821 non-null float64
calculated_host_listings_count    48858 non-null int64
availability_365                  48858 non-null int64
dtypes: float64(3), int64(7), object(6)
memory usage: 6.3+ MB
analysis_data.isnull().sum()
id                                    0
name                                  0
host_id                               0
host_name                             0
neighbourhood_group                   0
neighbourhood                         0
latitude                              0
longitude                             0
room_type                             0
price                                 0
minimum_nights                        0
number_of_reviews                     0
last_review                       10037
reviews_per_month                 10037
calculated_host_listings_count        0
availability_365                      0
dtype: int64
## index 를 재설정 해주어야 아래 코드에서 error 발생 안함
#analysis_data = analysis_data.reset_index(drop=True)

## 아래와 같은 방법으로 name 데이터 제거시 속도가 느림
## TODO : Pandas 의 빠른 방법이 있는지 확인 필요
#name_re = re.compile(r'^[a-zA-Z0-9.,_# ]+$')
#for index, name in enumerate(analysis_data['name']):
#    if name_re.search(name) == None:
#        analysis_data.drop([index], axis=0, inplace=True)
# 수정 : 문제에서 '-' 를 '_' 으로 잘 못 보아 파싱 구문이 달라짐
#        str.match 사용
# name_re = re.compile(r'^[a-zA-Z0-9.,_# ]+$')
name_re = re.compile(r'^[a-zA-Z0-9.,#\-\s]+$')
analysis_data = analysis_data[analysis_data['name'].str.match(name_re)]
analysis_data
| id | name | host_id | host_name | neighbourhood_group | neighbourhood | latitude | longitude | room_type | price | minimum_nights | number_of_reviews | last_review | reviews_per_month | calculated_host_listings_count | availability_365 | |
|---|---|---|---|---|---|---|---|---|---|---|---|---|---|---|---|---|
| 1 | 2595 | Skylit Midtown Castle | 2845 | Jennifer | Manhattan | Midtown | 40.75362 | -73.98377 | Entire home/apt | 225 | 1 | 45 | 2019-05-21 | 0.38 | 2 | 355 |
| 3 | 3831 | Cozy Entire Floor of Brownstone | 4869 | LisaRoxanne | Brooklyn | Clinton Hill | 40.68514 | -73.95976 | Entire home/apt | 89 | 1 | 270 | 2019-07-05 | 4.64 | 1 | 194 |
| 5 | 5099 | Large Cozy 1 BR Apartment In Midtown East | 7322 | Chris | Manhattan | Murray Hill | 40.74767 | -73.97500 | Entire home/apt | 200 | 3 | 74 | 2019-06-22 | 0.59 | 1 | 129 |
| 8 | 5203 | Cozy Clean Guest Room - Family Apt | 7490 | MaryEllen | Manhattan | Upper West Side | 40.80178 | -73.96723 | Private room | 79 | 2 | 118 | 2017-07-21 | 0.99 | 1 | 0 |
| 10 | 5295 | Beautiful 1br on Upper West Side | 7702 | Lena | Manhattan | Upper West Side | 40.80316 | -73.96545 | Entire home/apt | 135 | 5 | 53 | 2019-06-22 | 0.43 | 1 | 6 |
| ... | ... | ... | ... | ... | ... | ... | ... | ... | ... | ... | ... | ... | ... | ... | ... | ... |
| 48887 | 36483152 | Garden Jewel Apartment in Williamsburg New York | 208514239 | Melki | Brooklyn | Williamsburg | 40.71232 | -73.94220 | Entire home/apt | 170 | 1 | 0 | NaN | NaN | 3 | 365 |
| 48889 | 36484363 | QUIT PRIVATE HOUSE | 107716952 | Michael | Queens | Jamaica | 40.69137 | -73.80844 | Private room | 65 | 1 | 0 | NaN | NaN | 2 | 163 |
| 48890 | 36484665 | Charming one bedroom - newly renovated rowhouse | 8232441 | Sabrina | Brooklyn | Bedford-Stuyvesant | 40.67853 | -73.94995 | Private room | 70 | 2 | 0 | NaN | NaN | 2 | 9 |
| 48892 | 36485431 | Sunny Studio at Historical Neighborhood | 23492952 | Ilgar & Aysel | Manhattan | Harlem | 40.81475 | -73.94867 | Entire home/apt | 115 | 10 | 0 | NaN | NaN | 1 | 27 |
| 48893 | 36485609 | 43rd St. Time Square-cozy single bed | 30985759 | Taz | Manhattan | Hell's Kitchen | 40.75751 | -73.99112 | Shared room | 55 | 1 | 0 | NaN | NaN | 6 | 2 |
31739 rows × 16 columns
analysis_data.shape
(31739, 16)
- 리뷰
- 잘해주셨네요!
- pandas로 수행하는 방법으로는 ~.str.match 혹은 ~.str.contains가 존재합니다.
- analysis_data[‘name’]뒤에 걸어주신다면? 사용할 수 있을거에요
- 2차 리뷰
- compile 부분을 자세히 보니 빠진 부분이 좀 있네요
- 공백을 체크하는 부분, ‘,’ 부분이 빠져 있어요!
- 필터링된 데이터수가 31739가 나와야 합니다.
- 수정
- 조건식 수정하여 31739 확인 하였습니다.
- 3차 리뷰
- 잘해주셨습니다.
- 이제 완벽하게 regex가 적용되었네요
[Quiz 9] room_type의 모든 값을 구합니다. room_type으로 데이터를 GroupBy합니다. 각 Group 별로 price가 가장 높은 데이터의 (name, hostId, price)를 출력합니다. 동일한 값을 가지는 데이터가 있다면 전부 출력합니다.
# room_type의 모든 값
analysis_data['room_type'].unique()
array(['Entire home/apt', 'Private room', 'Shared room'], dtype=object)
analysis_data.groupby('room_type')['price'].max()
room_type
Entire home/apt    10000
Private room       10000
Shared room         1800
Name: price, dtype: int64
# room_type의 가장 높은 price 값
high_price_group = analysis_data.groupby('room_type').max()['price']
high_price_group
room_type
Entire home/apt    10000
Private room       10000
Shared room         1800
Name: price, dtype: int64
for room_type in analysis_data['room_type'].unique():
    group_type = analysis_data['room_type'] == room_type
    group_max_price = analysis_data['price'] == analysis_data.groupby('room_type').get_group(room_type).max()['price']
    print(analysis_data[group_type & group_max_price][['room_type', 'name', 'host_id', 'price']])
             room_type                                             name  \
17692  Entire home/apt  Luxury 1 bedroom apt. -stunning Manhattan views
29238  Entire home/apt                              1-BR Lincoln Center

        host_id  price
17692   5143901  10000
29238  72390391  10000
         room_type                                 name   host_id  price
9151  Private room  Furnished room in Astoria apartment  20582832  10000
         room_type                                    name   host_id  price
14380  Shared room  Mins away to Manhattan Suite Residence  24146326   1800
- 리뷰
- 잘해주셨는데 위의 데이터 때문인지 결과는 맞지 않네요
- Entire_home에서 2개가 나와야합니다
- 수정
- Quiz.8 문제에서 ‘-‘ 를 ‘_’ 으로 잘 못 보아 파싱구문에 문제가 있어 수정 하였습니다.
- 2차 리뷰
- 잘해주셨습니다!
- 전에는 오류가 나지 않았었던 것으로 기억하는데 저 부분에서 전 오류가 나네요..
- 결과를 찍어주신 것을 보면 저한테만 생기는 오류 같네요!
- 코드로 볼떄엔 문제 없습니다! 결과도 잘 나오네요
[Quiz 10] room_type이 가격에 영향을 주는지를 확인하기 위해 하나의 그래프 위에 그룹별로 0~500까지의 price위에서 10단위로 히스토그램을 그립니다.
# room_type 별 hist 의 color 설정
color_type = {'Entire home/apt': 'r', 'Private room': 'g', 'Shared room': 'b'}

# room_type 별 hist 그리기
for room_type in color_type:
    analysis_data[analysis_data['room_type'] == room_type]['price'].plot.hist(bins=range(0, 501, 10),
                                                                              color=color_type[room_type],
                                                                              label=room_type,
                                                                              alpha=0.6,
                                                                              figsize=(12,6))
plt.legend(title = 'room_type')
plt.xlabel('price')
plt.show()
[Quiz 11] SQL 사용 : 등록한 방이 가장 많은(row가 가장 많은) 10개의 host_id를 구한 후, 각 host_id별로 price의 평균을 구합니다. count가 많은 순서대로 출력합니다.
# # 4번 문제
# import sqlite3
# conn = sqlite3.connect(':memory:')
# conn.text_factory = str
# analysis_data.to_sql(name='data', con=conn)
# 이 부분이 여기 있으면 안됩니다.
# 본래 위치인 quiz8 위에서 먼저 선언되어야 합니다.
sql_data = pd.read_sql('select * from data', conn)
print(sql_data.columns)
print(sql_data.shape)
print(sql_data.count())
print(sql_data.info())
Index(['index', 'id', 'name', 'host_id', 'host_name', 'neighbourhood_group',
       'neighbourhood', 'latitude', 'longitude', 'room_type', 'price',
       'minimum_nights', 'number_of_reviews', 'last_review',
       'reviews_per_month', 'calculated_host_listings_count',
       'availability_365'],
      dtype='object')
(48858, 17)
index                             48858
id                                48858
name                              48858
host_id                           48858
host_name                         48858
neighbourhood_group               48858
neighbourhood                     48858
latitude                          48858
longitude                         48858
room_type                         48858
price                             48858
minimum_nights                    48858
number_of_reviews                 48858
last_review                       38821
reviews_per_month                 38821
calculated_host_listings_count    48858
availability_365                  48858
dtype: int64
<class 'pandas.core.frame.DataFrame'>
RangeIndex: 48858 entries, 0 to 48857
Data columns (total 17 columns):
index                             48858 non-null int64
id                                48858 non-null int64
name                              48858 non-null object
host_id                           48858 non-null int64
host_name                         48858 non-null object
neighbourhood_group               48858 non-null object
neighbourhood                     48858 non-null object
latitude                          48858 non-null float64
longitude                         48858 non-null float64
room_type                         48858 non-null object
price                             48858 non-null int64
minimum_nights                    48858 non-null int64
number_of_reviews                 48858 non-null int64
last_review                       38821 non-null object
reviews_per_month                 38821 non-null float64
calculated_host_listings_count    48858 non-null int64
availability_365                  48858 non-null int64
dtypes: float64(3), int64(8), object(6)
memory usage: 6.3+ MB
None
sql_data.head()
| index | id | name | host_id | host_name | neighbourhood_group | neighbourhood | latitude | longitude | room_type | price | minimum_nights | number_of_reviews | last_review | reviews_per_month | calculated_host_listings_count | availability_365 | |
|---|---|---|---|---|---|---|---|---|---|---|---|---|---|---|---|---|---|
| 0 | 0 | 2539 | Clean & quiet apt home by the park | 2787 | John | Brooklyn | Kensington | 40.64749 | -73.97237 | Private room | 149 | 1 | 9 | 2018-10-19 | 0.21 | 6 | 365 |
| 1 | 1 | 2595 | Skylit Midtown Castle | 2845 | Jennifer | Manhattan | Midtown | 40.75362 | -73.98377 | Entire home/apt | 225 | 1 | 45 | 2019-05-21 | 0.38 | 2 | 355 |
| 2 | 2 | 3647 | THE VILLAGE OF HARLEM....NEW YORK ! | 4632 | Elisabeth | Manhattan | Harlem | 40.80902 | -73.94190 | Private room | 150 | 3 | 0 | None | NaN | 1 | 365 |
| 3 | 3 | 3831 | Cozy Entire Floor of Brownstone | 4869 | LisaRoxanne | Brooklyn | Clinton Hill | 40.68514 | -73.95976 | Entire home/apt | 89 | 1 | 270 | 2019-07-05 | 4.64 | 1 | 194 |
| 4 | 4 | 5022 | Entire Apt: Spacious Studio/Loft by central park | 7192 | Laura | Manhattan | East Harlem | 40.79851 | -73.94399 | Entire home/apt | 80 | 10 | 9 | 2018-11-19 | 0.10 | 1 | 0 |
sql_data.isnull().sum()
index                                 0
id                                    0
name                                  0
host_id                               0
host_name                             0
neighbourhood_group                   0
neighbourhood                         0
latitude                              0
longitude                             0
room_type                             0
price                                 0
minimum_nights                        0
number_of_reviews                     0
last_review                       10037
reviews_per_month                 10037
calculated_host_listings_count        0
availability_365                      0
dtype: int64
# 등록한 방이 가장 많은(row가 가장 많은) 10개의 host_id
top10_reg_ID = sql_data['host_id'].value_counts().sort_values(ascending=False)[:10]
top10_reg_ID
219517861    327
107434423    232
30283594     121
137358866    103
12243051      96
16098958      96
61391963      91
22541573      87
200380610     65
7503643       52
Name: host_id, dtype: int64
# 등록한 방이 가장 많은(row가 가장 많은) 10개의 host_id
top10_reg_ID = sql_data['host_id'].value_counts().sort_values(ascending=False)[:10]
top10_reg_ID
# 정답의 값은 이렇게 나와요!! 같은 코드이지만 다른 결과값
219517861    327
107434423    232
30283594     121
137358866    103
12243051      96
16098958      96
61391963      91
22541573      87
200380610     65
7503643       52
Name: host_id, dtype: int64
# host_id 로 groupby 하여 상위 10개의 host_id 의 price 평균 구하기
top10_reg_ID_mean_price = sql_data.groupby('host_id').mean()['price'].loc[top10_reg_ID.index]
top10_reg_ID_mean_price
219517861    253.195719
107434423    303.150862
30283594     277.528926
137358866     43.825243
12243051     213.031250
16098958     208.958333
61391963     146.241758
22541573     215.436782
200380610    290.230769
7503643      149.192308
Name: price, dtype: float64
# ID 별 count 값, 평균 가격
result = pd.DataFrame([top10_reg_ID, top10_reg_ID_mean_price], index=['count', 'mean of price'])
result = result.transpose()
result
| count | mean of price | |
|---|---|---|
| 219517861 | 327.0 | 253.195719 |
| 107434423 | 232.0 | 303.150862 |
| 30283594 | 121.0 | 277.528926 |
| 137358866 | 103.0 | 43.825243 |
| 12243051 | 96.0 | 213.031250 |
| 16098958 | 96.0 | 208.958333 |
| 61391963 | 91.0 | 146.241758 |
| 22541573 | 87.0 | 215.436782 |
| 200380610 | 65.0 | 290.230769 |
| 7503643 | 52.0 | 149.192308 |
- 리뷰
- 보여주실때 count 값도 같이 있었으면 좋았겠지만
- 일단 위에서 나타내주시고 있기에 문제는 없을 것 같네요!
- 코드 상으로 문제는 없어 보이는데
- 위에서 데이터 필터링이 잘못되어 결과값이 다릅니다.
- 꼭 다시 한번 해보시고 결과값을 비교해보시기 바랍니다.
- 수정
- Quiz.8 문제에서 ‘-‘ 를 ‘_’ 으로 잘 못 보아 파싱구문에 문제가 있어 수정 하였습니다.
- 2차 리뷰
- 여기 있는 부분들도 위의 pattern이 제대로 잡히면
- 제대로 답이 나올 것 같아요!
- 3차 리뷰
- 코드는 정상인데 결과 값이 안 맞아서 한참 봤네요..
- 원래 있던 코드의 위치가 변하면서 데이터가 변해 그 결과값이 달랐던 거였습니다.
- 코드를 본래 위치에 놓으니 잘 나오네요!
- 수고하셨습니다.